Friday, August 1, 2008

7th Consecutive month job decline


8/1/08

The non-farm payroll actual number( -51k) is better than estimate number(-70k). But market is unable to turnaround. All major indexes are closed in negative note. Again, financial is the driven force for whole market to go up. XLF still struggle to breakup 50ma mark.

Thursday, July 31, 2008

Important test tomorrow

7/31/08

All major indexes are pulling back almost all of yesterday's gain. The most important economic data, non-farm payroll number will be announced tomorrow. If it meets the expectation ( -70k), it would bring back bulls in. Otherwise, test of 1150 of S&P is for sure. I will try to post more tomorrow morning.

End of month S&P daily chart


7/31/08

Although markets are still open, I put this in advance to remind people again. This is BEAR market. Each rally will fade in some point no matter what you think or wish. Yes, it will end but not in my sight so far for the rest of this year. Period.

Bullish wedge up S&P


7/31/08

Despite the worst than expect GDP, market gap down open but keep rising. It is very bullish so far. No sell signal given.

Wednesday, July 30, 2008

Second strong up day

7/30/08

I am so right that S&P did ignite the rally at the exact my previous support target zone 1135-1140. What a over 400 points Dow turnaround in 2 days!! This is how the chart telling me. Tomorrow, it will be little tricky. I need to see how the market opening level to determine if there still has legs to go one more day and break the 11700-11750 area for the Dow, 1192-1195 for the S&P. Especially, XLF financial index form a doji star today. It means no decision. In order to carry forward the market rally, XLF has to break the 22.68-23 resistance zone. Tomorrow morning, GDP will be announced but I expect it will not affect the market too much. The most important factor still behind the financial. Not economic data or crude oil future price. Another factor behind the market staying mode is institutional core holdings. The institutional index is approaching double resistance on daily basis( It is so secret that cannot show here ). So, this week movement would determine if S&P carry over 1300 into 1325 (Target of this intermediate rally end).

S&P intraday chart


7/30/08

It is now 8:55am in central time. Here the S&P intraday 15mins chart. Let see what will happen. Market should pullback and seesaw from now unless financials breakup.
Remember, there is no 100% accurate trading signals, the key to success is persistence and follow the probability in the long term. Also, it guides us what price & when to enter & exit, do long or short. Whoever react quick with correct plan are must in these kind of market if trading short term.

Need financial to go up


7/30/08

In order to carry over the rally upward, XLF has to breakup next two important resistance level as post on left chart.

Tuesday, July 29, 2008

Strong reversal as expect

7/29/08

Major indexes are turning back up strong as expected despite people saying because crude oil future is down and better confidence economic number. Those are the excuse that most people do not know how the market real movement. Now the problem come in. Market has tradable bottom. What would this rally bring up to? I need to see follow thought upward bias seesaw action as well as financial keeping the strength to gradually recover. The next S&P strong resistance is around 1291-1295. So far, this rally may not be as strong as the run from 3/08-5/08. MER has been doing the same dump method as "Enron" did. Well, in fact, Citi is doing the same too of last time raising the capital. How disappointed that MER keep telling lie to investors that no need to raise capital. They will all keep doing the same again and again until they are trading in signal digits ( none of investors would have confidence to own financial shares). Friday would decide if there any legs up since the payroll data is the most important economic data that market focus on.

Pro speaking

7/29/08

I repost it from The Belkin Report. It is very very make sense.

“Most global stock indexes have decisively broken below their 200 week moving averages, which is a major trend reversal. The intermediate term (3 month) and long term (12 month) model forecasts point down. We recommend taking advantage of every minor rally to close long positions, go short and shift out of tech and cyclicals into defensive groups. Stock indexes haven’t yet had the big surge in volatility (5% daily NASDAQ moves down and up amidst a declining market). That is probably approaching. Bear market trading is typically more productive selling into those big percentage bounces, rather than selling into big declines and then watching the market bounce back in your face.

Potential downside targets after a 200 week average breakdown are 1) the 200 month average and 2) The previous 2002-2003 lows. Those levels are 25%-47% below current levels for most stock indexes. U.S. financial indexes are already there (BKX, XLF). So don’t think it can’t happen for the broader market and other currently elevated indexes, stocks and groups.”

Michael Belkin
The Belkin Report
July 6, 2008

CSIQ buy kick in


7/29/08

Let chart speak again!! Golden ratio of risk vs reward at least 1:2 or better. First target is 36-37. Or take half profit when hit the target, let the rest run to next close to 45 or higher. See how technical tells you what to do. Do not let emotion control you. If it fails, get out 24.25. Let see if this play out or not. Again, it is for educational purpose only. I wanna to show how powerful technical DO make you profit in trading stocks in long run. Simple.

Short term buy signal kick in


7/29/08

Do anyone see how accurate my TA work for last couple days?? Do I know this morning the crude oil future would drop? Even very bad news for MER but market bounce as I expect before the bad news came out. How could I do that? I just read chart and tell you what I see. It is that simple. The is the "W" shape bottom. Of course, have to see how today closing at what level. But I am so confident market would post big gain to almost cover yesterday loss.

Monday, July 28, 2008

Another S&P 15mins chart


7/28/08

Let the chart speak!!

Financials pull down the market

7/28/08

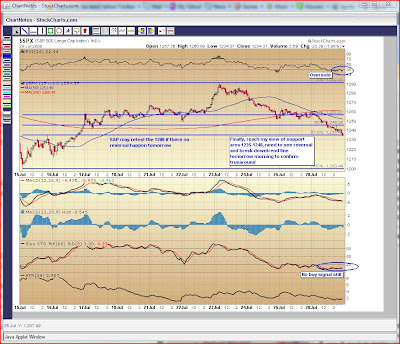
"The IMF(International Monetary Fund) stated no end in sight for the housing crisis causing another hit to financial shares which led the markets on a steep decline. " This is one of the financial website headline describe today's market recap. I am laughing loud for that misleading statement. I guess even a 11 years old child know what was going on about US economy. It is because they all cannot go to extra activities that they usually could do. For example, music schools, painting learning, dancing schools, and karate...etc. It is because their parents are suffering and deeply cutting down their budget to cope with reality. The reason I wanna point out here is market down significant today not because of IMF saying. It is natural technical pullback that I(and other market technicians) already knew since last thursday. It is the CHART telling me what would happen as of today's decline. It is the market breadth that I can see it before and the chance in my favor that market need a pullback before it goes up higher. It is just simple as that.
Recently, I have been posting more charts to let people see what I see. Of course, it needs more time and skills to understand what is the real meaning of the charts that I posted. But I simply making little words to describe what will be going on. It all involves certain condition. Tomorrow, I am expecting market would reverse as I see the S&P is in the reversal zone. But, not until I see there more evidence to see the market turnaround, the market has chance to retest the 7/15 lows since all major indexes are closed at lows of the day. There have GDP as well as non-farm payroll data for this busy economic news week.

S&P testing 1250 level intraday


7/28/08

Market should be pulling back more. I mean going lower to do "W" recovery. I need to revise lower on the next support of S&P is around 1235-1240 rather 1240-1250. Let see if market ignite rally from that level.