2/21/09
To fellow blog readers:
I call it the historical, incredible shrinking Dow tanking since December 2007.
12800 (My official level to determine Dow has finally gone into Bear Market Territory)
10800
8800
7450-7550(Last November Low Area)
7250-7350(Last friday trading day low zone area)
12800 down drain to 7250(So far I saved you 5550 points decline that lose your $$$, yes you if you started to read my blog from beginning)
Next Stop 6,000 ??!
Very Very Sadly, I believe that is quite possible. And I even believe it may go to 4000s area if stimulus plan does not work at all. The government only knows printing trillions of dollars at our economic woes, but all their desperation is doing nothing to truly solve the root of current problems.
So the stock market is headed for another rough road ahead. Rallies may briefly raises false hopes. But reality will kill them again and again and again.
Remember when Dow was traded above 10000 almost every Wall Street experts has called:
"That's the bottom!" (when Dow 10000)
"No, that's the bottom!!" (when Dow 9000)
"Now this is is finally finally th....e bottom..!!!!" (when Dow 7500 last November)
They have been wrong, wrong and wrong, and I have been right, over, over and over again.
Enough of brag myself here. I just want to re-emphasis how important to trade or invest stock market with perspective of technical analysis. This is one and only one knowledge essential to make profit in stock market or any securities.
Saturday, February 21, 2009
Revisit last important bear market lows
2/21/09
The following post are written by a self-taught technical analyst who just like me.
The retest of the November lows has finally came. The S&P 500 is still slightly above that support, but the Dow has penetrated it. Even every rally since November has been greeted with hope of a new advance that would end the bear market, the market gradually rolled over into a declining trend after the January top.
The November bottom was also a 9-Month Cycle bottom. In a bull market we would expect the market to rally for several months. The fact that the rally failed so quickly, is a very very bearish sign.
The long term shows that the 2002 bear market lows are also being tested again, so the market is at a very critical point. Many people who are still holding equities (at a 50% loss) are counting on being bailed out by a big rally. If prices fall significantly below long-term support, we are likely to see another heavy selling.
The long-term condition of the market is deeply oversold, as demonstrated by the Percent of Stocks Above Their 200-EMA. This indicator has never been at these low levels for such an extended period of time. Normally, a rally is in the cards as soon as these levels are reached, but the market is flat on its back, and it is hard to say when it will recover. It is important not to get too anxious to get back in. We are in a bear market, and negative outcomes are much more likely than positive ones.
Also, remember that oversold conditions in a bear market are extremely dangerous. If the current support zone fails, a market crash could quickly follow.
Bottom Line: The market is in the midst of a retest of very important support. Since we are in a bear market, I expect that the support will fail.
My comment: I strongly agree with this talent technician. We have been proved correct in most market forecast, especially there are no other good tactic beside trading with technical.
Friday, February 20, 2009
Technical View for S&P and Dow Jones Index

 2/20/09
Dow Jones Index is making fresh bear market low. However, it formed hammer doji star with heavy volume and it requires follow though day to confirm this downtrend technically. This is also same for S&P Index. Would S&P call a successful retest low of 2008??! On daily basis, it does need to see coming monday action to determine if this intermediate down trend end today. If we look at the time that today 2/20/09 just exactly 3 months away from last intermediate low at 11/20/08, interesting, isn't it??!
Now, do you remember how many so called Wall Street "Guru" or "Analysist" that last Novermber low is this Bear market bottom??! But, I disagree with them long time ago. I do call this secular bear started since 12/2007 as I started to write this blog. My offical count begun Dow breakdown 12800. How many points we away from that mark??! It is amzaing 5400 points!!! Again, 90% of Wall Street professionals need to go back study what is technical analysis. Only better technicans, Of course I am one of them, are seeing this will happen way ahead anyone. I cannot emphasis how powerful that technical analysis bring me forecast the stock market, each individual stock... Have a nice weekend!!!
Let's Nationalize Banks!!!


2/20/09
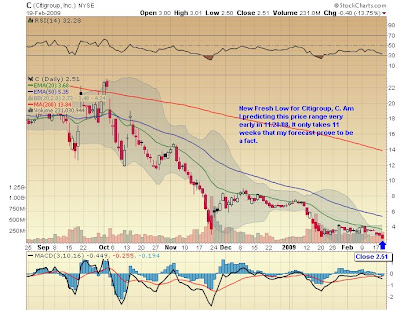
Let's see two of biggest banks charts here!!! Nationalization Voice is getting louder and louder that make C and BAC going to drain. Folks, the whole down process is acting perfect technically. The 20MA on daily basis is strong resistance lines and this is the area I recommend to my clients to sell short the stock til today. Yes, so easy!!! so simple!!! However, both stocks are setting reversal pattern and it needs follow thought day to confirm ending this intermediate downtrend.
Technical explantion of this leg down


2/20/09
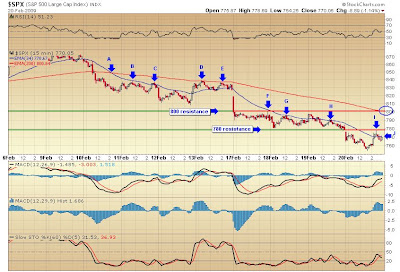
S&P index did close to touch closing low of 2008 (Today intra-day low 754.25). Technically, it formed Spinning Doji Star pattern and need follow though day pattern to verify if this is intermediate term bottom. At this post, I want to explain how to notice the resistance on this downtrend leg.
On 15mins chart above:
A. Bearish Moving Average Deadly Crossover (Sell Signal based on moving average)
B. 2/11 intra-day high got hit by 34EMA
C. same as B
D. 2/13 that 200EMA act as resistance point on intra-day basis
E. same as D
F. Intra-day breakout head fake at very close to 800( The support zone previously I mentioned 800-805 if you do follow my blog. However, 800-805 were acting resistance zone once the market traded below it)
G. 2/18 that 34EMA played resistance again
H. same 34EMA barrier area for 2/19 on intra-day basis
I. short covering rally hit the gap open mark which is 780, as resistance mark ( Hanging man candlestick pattern too)
J. close just shy below 34EMA
Folks, notice how nicely just the moving average marks are acting resistance zone as the market trending down since point A(Deadly crossover) on 2/10. Also, please understand as market is trending lower, so as the moving average lines. I though this is very good example to show you all how to visualize the short term market action. As least, this is what I see and there is no secret. "Trend is your friend" to all traders is a wisdom and must to follow. Then when it will reverse the course and bounce back??? I will try to show it here when it comes. However, no matter how people told you the market is very very very oversold, it does not mean it will reverse the market action. We need to see the trend got broken and more ( market breadth,internal datas...etc) to confirm. Moreover, panic selling are often happening during market in oversold condition. I do not see enough panic selling yet happening even as of today action. Next monday would be a critical day to watch in order to determine if today is acting as continuously pattern or reversal patten. Interesting observation here is today 2/20/09 exactly 3 months after last market low on 11/20/08. Time is also a component to be in technical analysis. So, this add more interesting and importance to see how market perform on coming monday 2/23/09. Have a good friday evening everyone!!
Thursday, February 19, 2009
Update C Chart
New Bear Market Lows for Dow


2/19/09
Folks!!! New Bear Market lows for Dow has reached today!!! Who is better forecaster or stock analysis, I guess everyone of you know how my studies reward me foresee new lows for stock market. However, consider the broader market has last defense area 750 for S&P. Intermediate bottom may be around the corner.
Wednesday, February 18, 2009
Oversold rebound expect tomorrow?!
 2/18/09
Major stock market indexes are in neutral condition today. It formed Doji star which it means bulls and bears power are in balance. In short term basis, it has reason to get technical rebound. However, if market is going lower than today's intra-day low, it can go much lower. The morning first trading hour would likely to answer my question?! Let us see!!
Tuesday, February 17, 2009
Chart of NYA
Retest 2008 lows for Dow !!!
Subscribe to:
Comments (Atom)


