
2/20/09
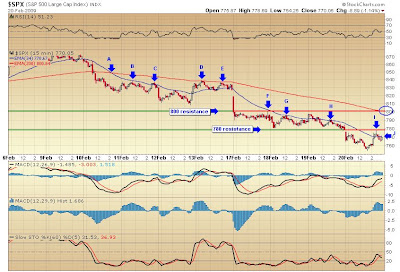
S&P index did close to touch closing low of 2008 (Today intra-day low 754.25). Technically, it formed Spinning Doji Star pattern and need follow though day pattern to verify if this is intermediate term bottom. At this post, I want to explain how to notice the resistance on this downtrend leg.
On 15mins chart above:
A. Bearish Moving Average Deadly Crossover (Sell Signal based on moving average)
B. 2/11 intra-day high got hit by 34EMA
C. same as B
D. 2/13 that 200EMA act as resistance point on intra-day basis
E. same as D
F. Intra-day breakout head fake at very close to 800( The support zone previously I mentioned 800-805 if you do follow my blog. However, 800-805 were acting resistance zone once the market traded below it)
G. 2/18 that 34EMA played resistance again
H. same 34EMA barrier area for 2/19 on intra-day basis
I. short covering rally hit the gap open mark which is 780, as resistance mark ( Hanging man candlestick pattern too)
J. close just shy below 34EMA
Folks, notice how nicely just the moving average marks are acting resistance zone as the market trending down since point A(Deadly crossover) on 2/10. Also, please understand as market is trending lower, so as the moving average lines. I though this is very good example to show you all how to visualize the short term market action. As least, this is what I see and there is no secret. "Trend is your friend" to all traders is a wisdom and must to follow. Then when it will reverse the course and bounce back??? I will try to show it here when it comes. However, no matter how people told you the market is very very very oversold, it does not mean it will reverse the market action. We need to see the trend got broken and more ( market breadth,internal datas...etc) to confirm. Moreover, panic selling are often happening during market in oversold condition. I do not see enough panic selling yet happening even as of today action. Next monday would be a critical day to watch in order to determine if today is acting as continuously pattern or reversal patten. Interesting observation here is today 2/20/09 exactly 3 months after last market low on 11/20/08. Time is also a component to be in technical analysis. So, this add more interesting and importance to see how market perform on coming monday 2/23/09. Have a good friday evening everyone!!

No comments:
Post a Comment